Solar panels for warehouses in Wolverhampton
The economics of a Wolverhampton rooftop array turn on how much of the generation the occupier uses on site. Each survey records the cladding profile, the usable area once rooflights and plant are removed, and the export limit worth applying for.
839 kWh per kWp a year at this latitude, so a 500 kWp array models at about 420,000 kWh. Source: EU PVGIS v5.2, SARAH3, 10 degree pitch, 14 percent system loss.
Book a roof survey in WolverhamptonIllustrative layout for a unit of this size. Your own figures come from the roof survey.
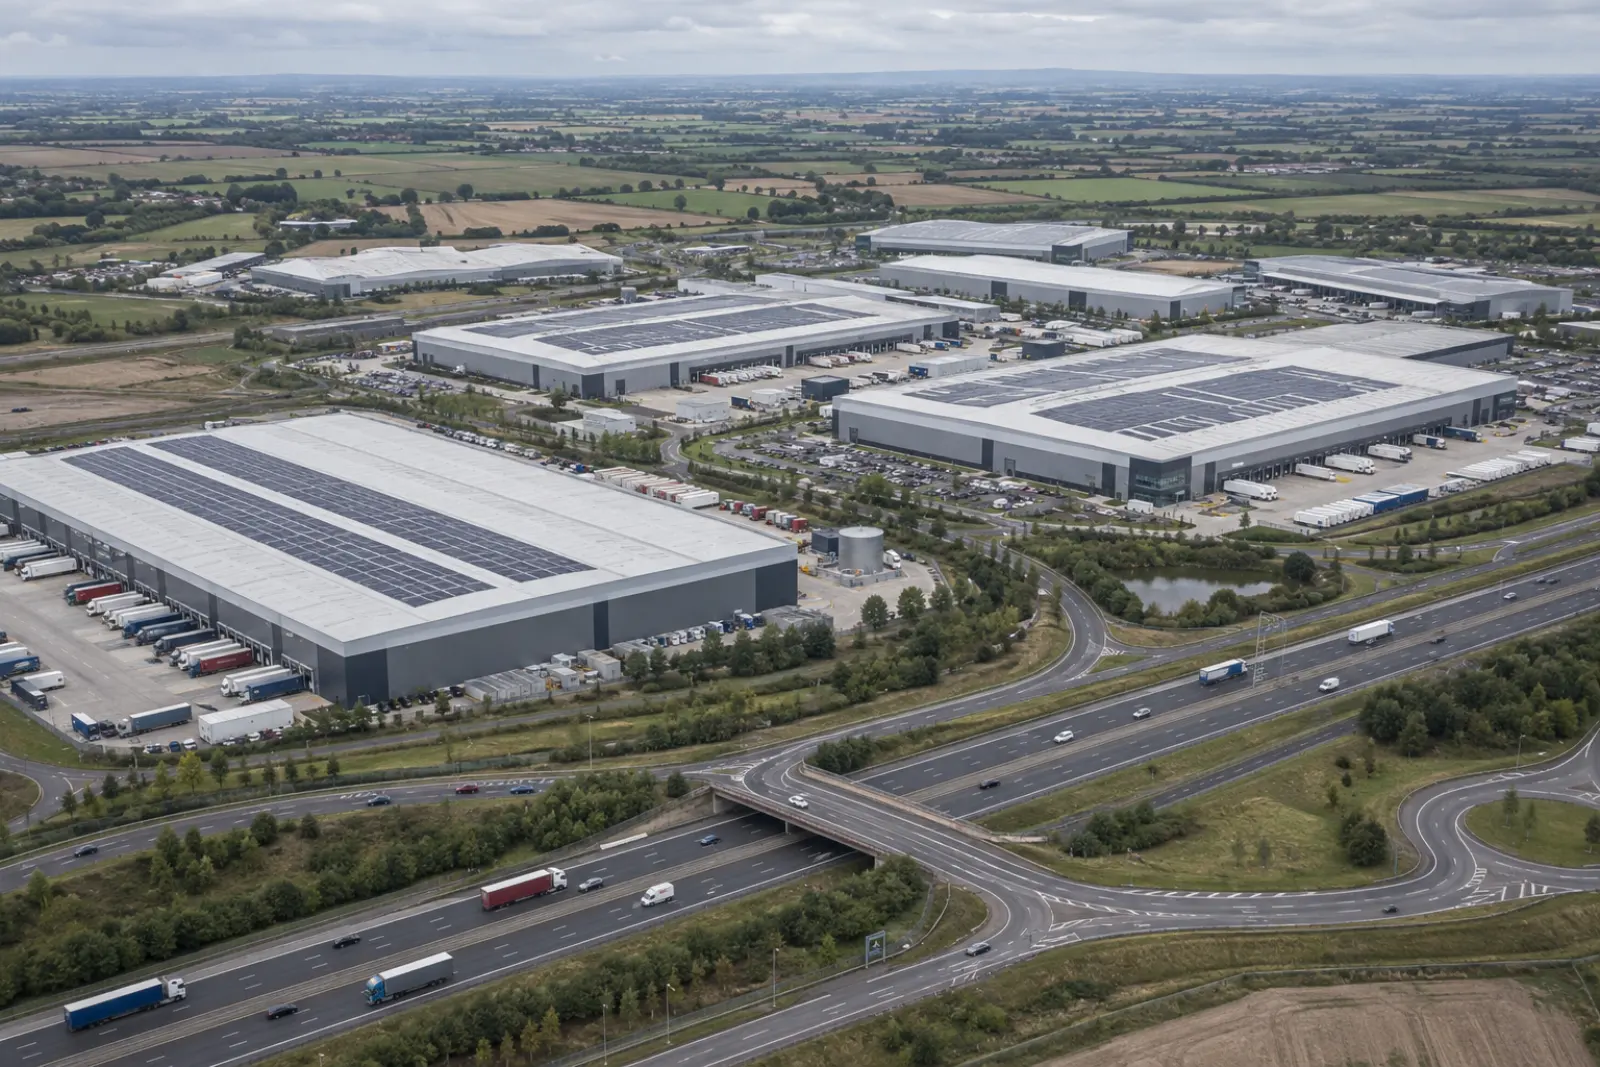
Warehouse rooftop solar across West Midlands
What a roof in Wolverhampton actually generates
Modelled irradiation at this latitude is 1076 kWh per square metre a year in the plane of a shallow-pitched roof, which works out at 839 kWh for every kWp installed (EU PVGIS v5.2, SARAH3, 10 degree pitch, 14 percent system loss). That is about 5 percent below the mean across the towns we cover, so the case here leans harder on how much you use on site rather than on raw generation.
Distribution stock around Wolverhampton clusters on M54 J2, M6 J10 and M6 J11, which is where the large single-let roofs are.
Most of the units we look at here sit in the WV postcode area.
Wolverhampton is the planning authority for most sites here, and the built-up area holds a population of about 234,025, the size that tends to be served by mid-box last-mile units rather than national hubs (ONS Census 2021 built-up areas).
Wolverhampton ranks 8 of 8 towns we cover in West Midlands on modelled yield, against a national mean of 886 kWh per kWp. The county runs from 839 to 868, a spread of 29 kWh per kWp. Within West Midlands that difference is small enough to ignore: where the building sits is not what decides this scheme, your consumption pattern is.
Solar already consented near WV1
From the government's Renewable Energy Planning Database, Q1 2026. These are the schemes on record in this postcode district, which is a fair guide to how the local network has been treating export applications.
| Scheme | Operator | Capacity | Mounting | Status |
|---|---|---|---|---|
| Mander Square, Mander Centre - Solar Panels | Bankfoot APAM Limited | 0.41 MW | Roof | Awaiting Construction |
Grid connection through National Grid Electricity Distribution
Connections around Wolverhampton are handled by National Grid Electricity Distribution, which sets the export limit for the site. Above 3.68 kW per phase the connection runs under G99, so the export limit is agreed in advance rather than assumed. Where the local network is constrained, an export-limited connection usually still makes the scheme work, because a warehouse uses most of what the roof makes during the working day.
Across West Midlands the planning database records 195 solar schemes totalling 533 MW, of which 3 are operational (REPD Q1 2026).
Send us the postcode
Tell us where the unit is and roughly how big the roof is. We come back with what it can carry, what it would generate against your consumption, and the three ways to pay for it.
Lenzie Consulting Ltd arranges the survey and passes your details to our MCS-certified installation partner so they can quote.
Questions about solar in Wolverhampton
- What would a 500 kWp array produce in Wolverhampton?
- Yes, and the number matters more than the sunshine. At 839 kWh per kWp a year, a 500 kWp array on a Wolverhampton roof models at around 420,000 kWh. What changes the answer is how much of that you use on site rather than export. Source: EU PVGIS v5.2, SARAH3, 10 degree pitch, 14 percent system loss.
- Which network operator handles the connection in Wolverhampton?
- Applications go to National Grid Electricity Distribution, who run the network across West Midlands. They decide the export limit, and we handle the G99 paperwork alongside the array design.
- What does Wolverhampton require for rooftop solar?
- Roof-mounted panels on a commercial building usually fall under permitted development, subject to the limits on projection above the roof plane and to the building not being listed or in a conservation area. We confirm the position with Wolverhampton before the design is finalised.