Solar panels for warehouses in Bedminster
Sheds around Bedminster tend to have more roof than the business has any other use for. What decides a scheme here is the state of the covering and the load path, which is why the survey starts on the roof rather than in a spreadsheet.
906 kWh per kWp a year at this latitude, so a 500 kWp array models at about 453,000 kWh. Source: EU PVGIS v5.2, SARAH3, 10 degree pitch, 14 percent system loss.
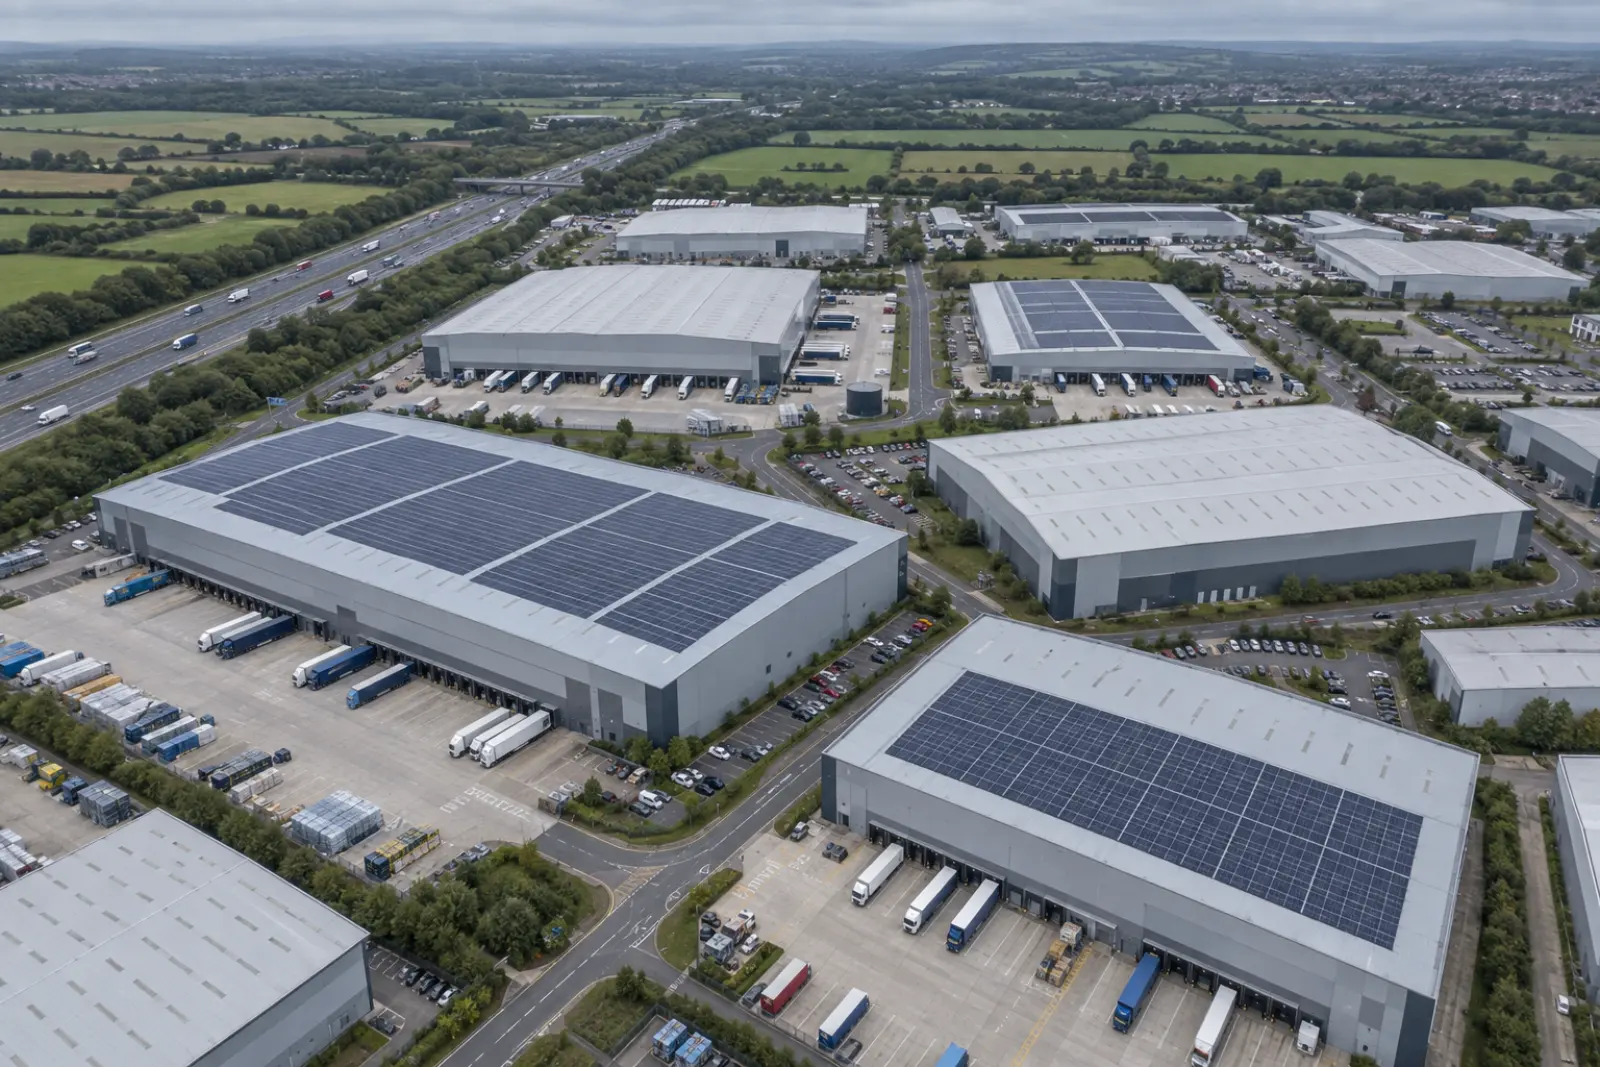
Book a roof survey in BedminsterIllustrative layout for a unit of this size. Your own figures come from the roof survey.
Distribution centre solar across Bristol
What a roof in Bedminster actually generates
Modelled irradiation at this latitude is 1158 kWh per square metre a year in the plane of a shallow-pitched roof, which works out at 906 kWh for every kWp installed (EU PVGIS v5.2, SARAH3, 10 degree pitch, 14 percent system loss). That sits within a few percent of the mean across the towns we cover, so the case rests on your consumption pattern rather than on the weather.
Bedminster ranks 2 of 5 towns we cover in Bristol on modelled yield, against a national mean of 886 kWh per kWp. The county runs from 895 to 908, a spread of 13 kWh per kWp. Within Bristol that difference is small enough to ignore: where the building sits is not what decides this scheme, your consumption pattern is.
Grid connection through National Grid Electricity Distribution
Connections around Bedminster are handled by National Grid Electricity Distribution, which sets the export limit for the site. Above 3.68 kW per phase the connection runs under G99, so the export limit is agreed in advance rather than assumed. Where the local network is constrained, an export-limited connection usually still makes the scheme work, because a warehouse uses most of what the roof makes during the working day.
Send us the postcode
Tell us where the unit is and roughly how big the roof is. We come back with what it can carry, what it would generate against your consumption, and the three ways to pay for it.
Lenzie Consulting Ltd arranges the survey and passes your details to our MCS-certified installation partner so they can quote.
Questions about solar in Bedminster
- What would a 500 kWp array produce in Bedminster?
- Yes, and the number matters more than the sunshine. At 906 kWh per kWp a year, a 500 kWp array on a Bedminster roof models at around 453,000 kWh. What changes the answer is how much of that you use on site rather than export. Source: EU PVGIS v5.2, SARAH3, 10 degree pitch, 14 percent system loss.
- Which network operator handles the connection in Bedminster?
- Applications go to National Grid Electricity Distribution, who run the network across Bristol. They decide the export limit, and we handle the G99 paperwork alongside the array design.