Solar panels for warehouses in Falmouth
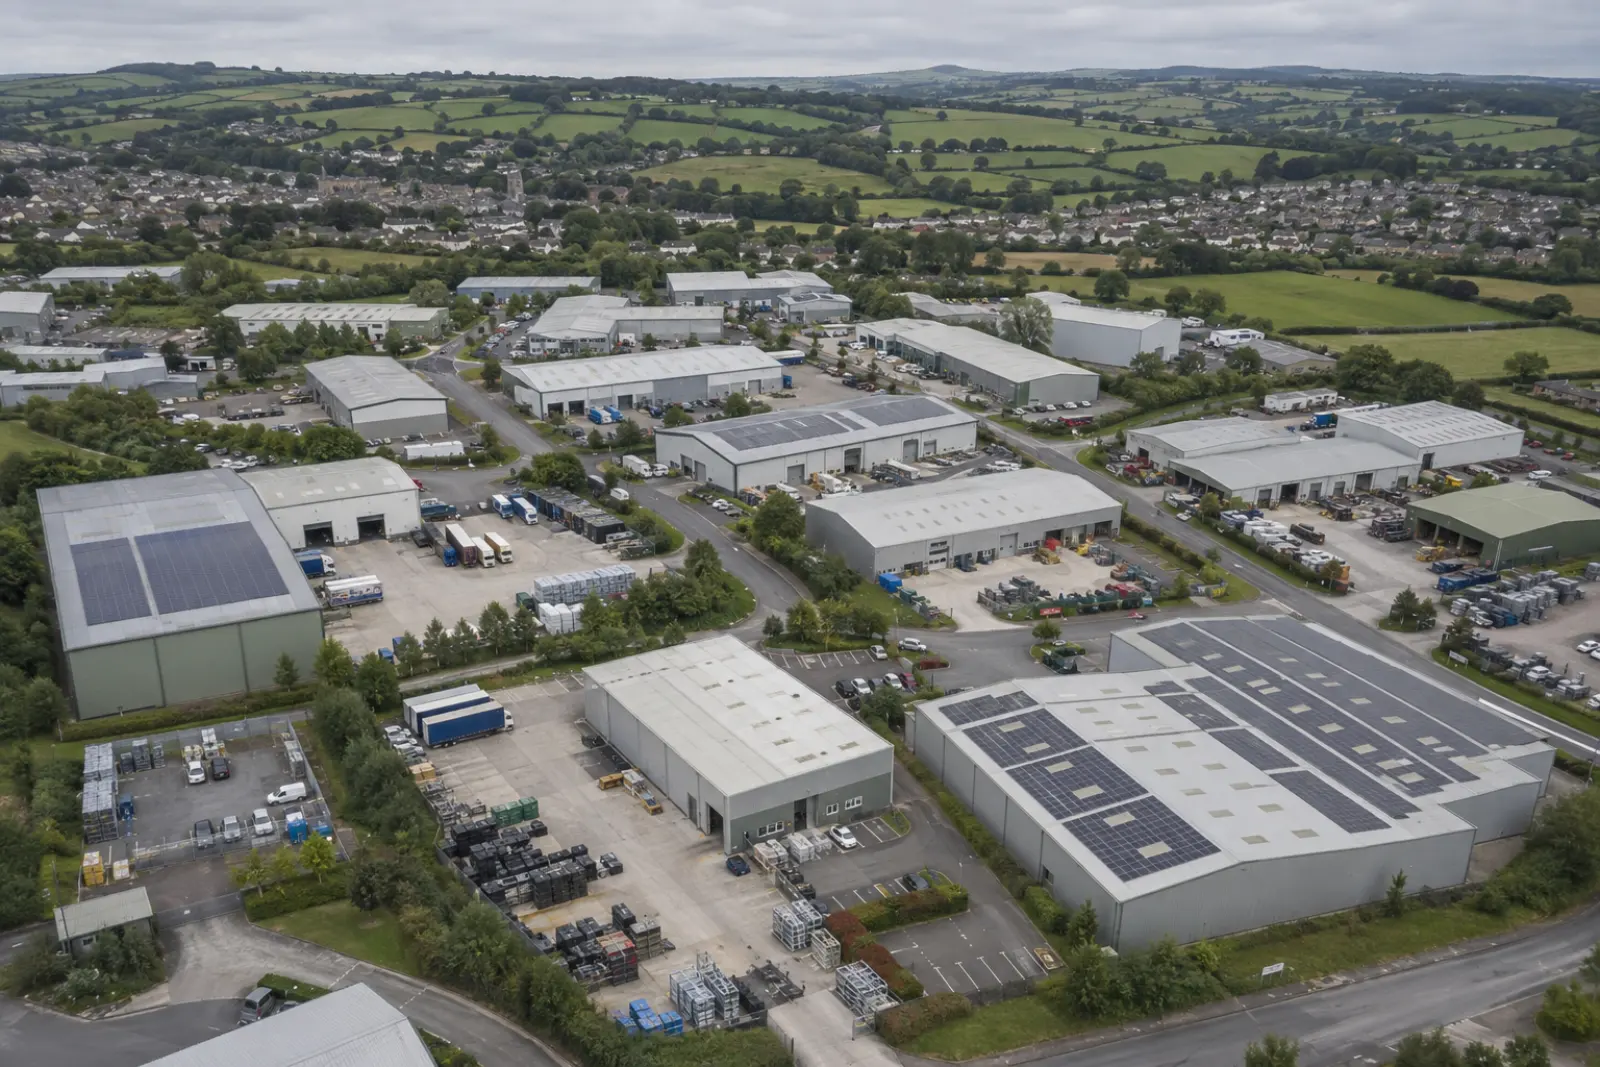
Most of the industrial stock around Falmouth carries a large, shallow-pitched roof that was never asked to do anything. Each survey records the cladding profile, the usable area once rooflights and plant are removed, and the export limit worth applying for.
943 kWh per kWp a year at this latitude, so a 500 kWp array models at about 472,000 kWh. Source: EU PVGIS v5.2, SARAH3, 10 degree pitch, 14 percent system loss.
Book a roof survey in FalmouthIllustrative layout for a unit of this size. Your own figures come from the roof survey.
Distribution centre solar across Cornwall
What a roof in Falmouth actually generates
Modelled irradiation at this latitude is 1203 kWh per square metre a year in the plane of a shallow-pitched roof, which works out at 943 kWh for every kWp installed (EU PVGIS v5.2, SARAH3, 10 degree pitch, 14 percent system loss). That is around 6 percent above the mean across the towns we cover, which is as good as UK rooftop gets outside the south coast.
We survey across the TR postcode area, starting from TR11.
Cornwall is the planning authority for most sites here, and the built-up area holds a population of about 24,070, so the stock here runs to trade counters, light industrial terraces and the occasional larger shed (ONS Census 2021 built-up areas).
Falmouth ranks 2 of 8 towns we cover in Cornwall on modelled yield, against a national mean of 886 kWh per kWp. The county runs from 921 to 979, a spread of 58 kWh per kWp. On a 500 kWp array that is about 29,000 kWh a year between the strongest and weakest town in the county.
Solar already consented near TR11
From the government's Renewable Energy Planning Database, Q1 2026. These are the schemes on record in this postcode district, which is a fair guide to how the local network has been treating export applications.
| Scheme | Operator | Capacity | Mounting | Status |
|---|---|---|---|---|
| LITTLE TREVEASE SOLAR PARK | Private Developer | 5.3 MW | Ground | Operational |
| Higher Tregarne Solar Farm | John Laing Environmental Assets | 5 MW | Ground | Operational |
| Watson Marlow, Bickland Water Road - Solar Pv Panels | Watson Marlow Limited/Bio Pure Technology | 0.34 MW | Roof | Awaiting Construction |
Grid connection through National Grid Electricity Distribution
National Grid Electricity Distribution operates the distribution network across Cornwall, so the export application goes to them. Anything larger than 3.68 kW per phase falls under G99, which means an application before commissioning rather than a notification afterwards. A constrained network is not the end of a scheme. Capping export costs little when the building already absorbs most of what the roof produces.
Across Cornwall the planning database records 174 solar schemes totalling 1116 MW, of which 88 are operational (REPD Q1 2026).
Send us the postcode
Tell us where the unit is and roughly how big the roof is. We come back with what it can carry, what it would generate against your consumption, and the three ways to pay for it.
Lenzie Consulting Ltd arranges the survey and passes your details to our MCS-certified installation partner so they can quote.
Questions about solar in Falmouth
- Is there enough sun in Falmouth to make this work?
- Modelled at 943 kWh per kWp a year for a shallow-pitched roof at this latitude, which puts a 500 kWp array at roughly 472,000 kWh a year before shading. That array needs about 1,485 sqm of clear roof once walkways and setbacks are allowed for. Source: EU PVGIS v5.2, SARAH3, 10 degree pitch, 14 percent system loss.
- Who do we apply to for export in Falmouth?
- Capacity varies street by street, and only National Grid Electricity Distribution can answer it for your connection. We ask the question early, because an export-limited offer changes the design rather than killing the scheme.
- Do we need planning permission in Cornwall?
- In most cases no, because roof-mounted panels on commercial buildings sit within permitted development. The exceptions are listed buildings, conservation areas and arrays that stand proud of the roof plane. We check with Cornwall first either way.
- Has anyone near TR11 already done this?
- The planning database records 3 solar schemes in this postcode district, 1 of them roof mounted. That matters less as proof that it works and more as evidence of how the local network has been treating export applications. Source: Renewable Energy Planning Database, Q1 2026.